 ETHORITY®
In this article
Terms used in this article
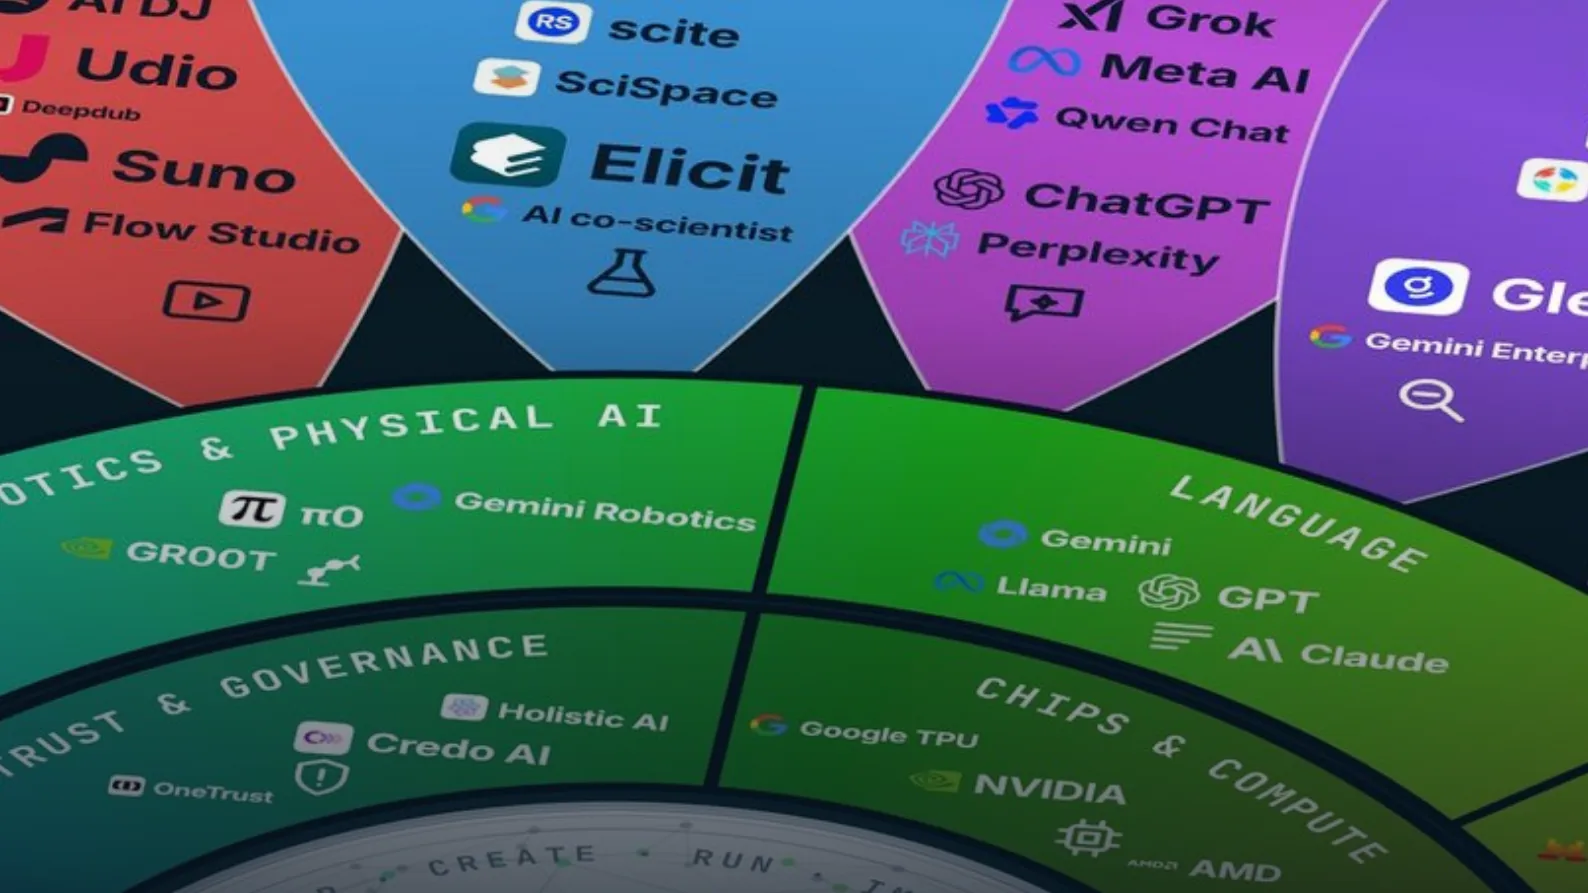
Good AI Prism v3.12 · full spectrum, rotated macro · Good AI Prism artwork © 2026 ETHORITY & STEN.AI LLC · CC BY-NC-ND 4.0 · data and third-party marks not covered.
Good AI Prism v3.12 · Sten Franke & ETHORITY
Source study · v2.1 · page 9 · Figure published: 25 Oct 2026
Read figure text, sources and rights
Good AI Prism v3.12 · full spectrum, rotated macro · Good AI Prism artwork © 2026 ETHORITY & STEN.AI LLC · CC BY-NC-ND 4.0 · data and third-party marks not covered.
ETHORITY figure. Rights in cited data and third-party marks remain with their owners. The Prism artwork licence applies where stated on the figure.
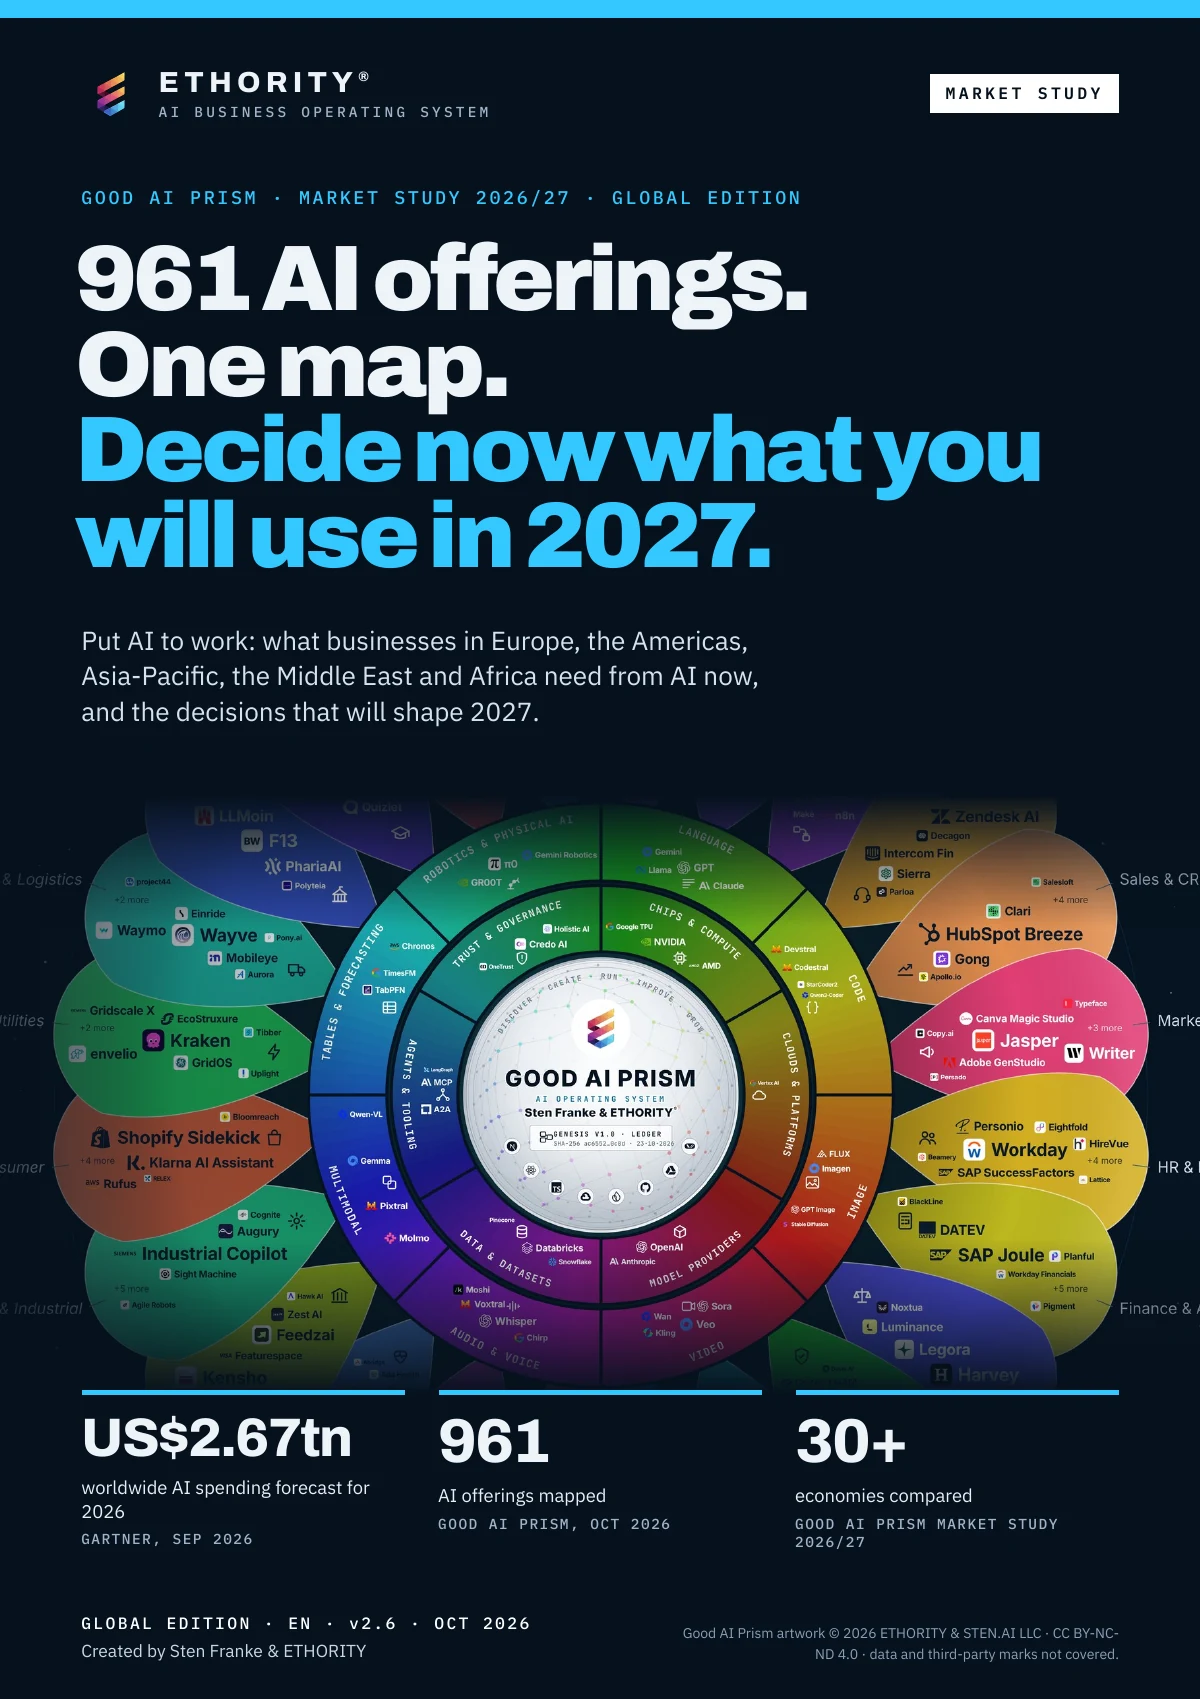
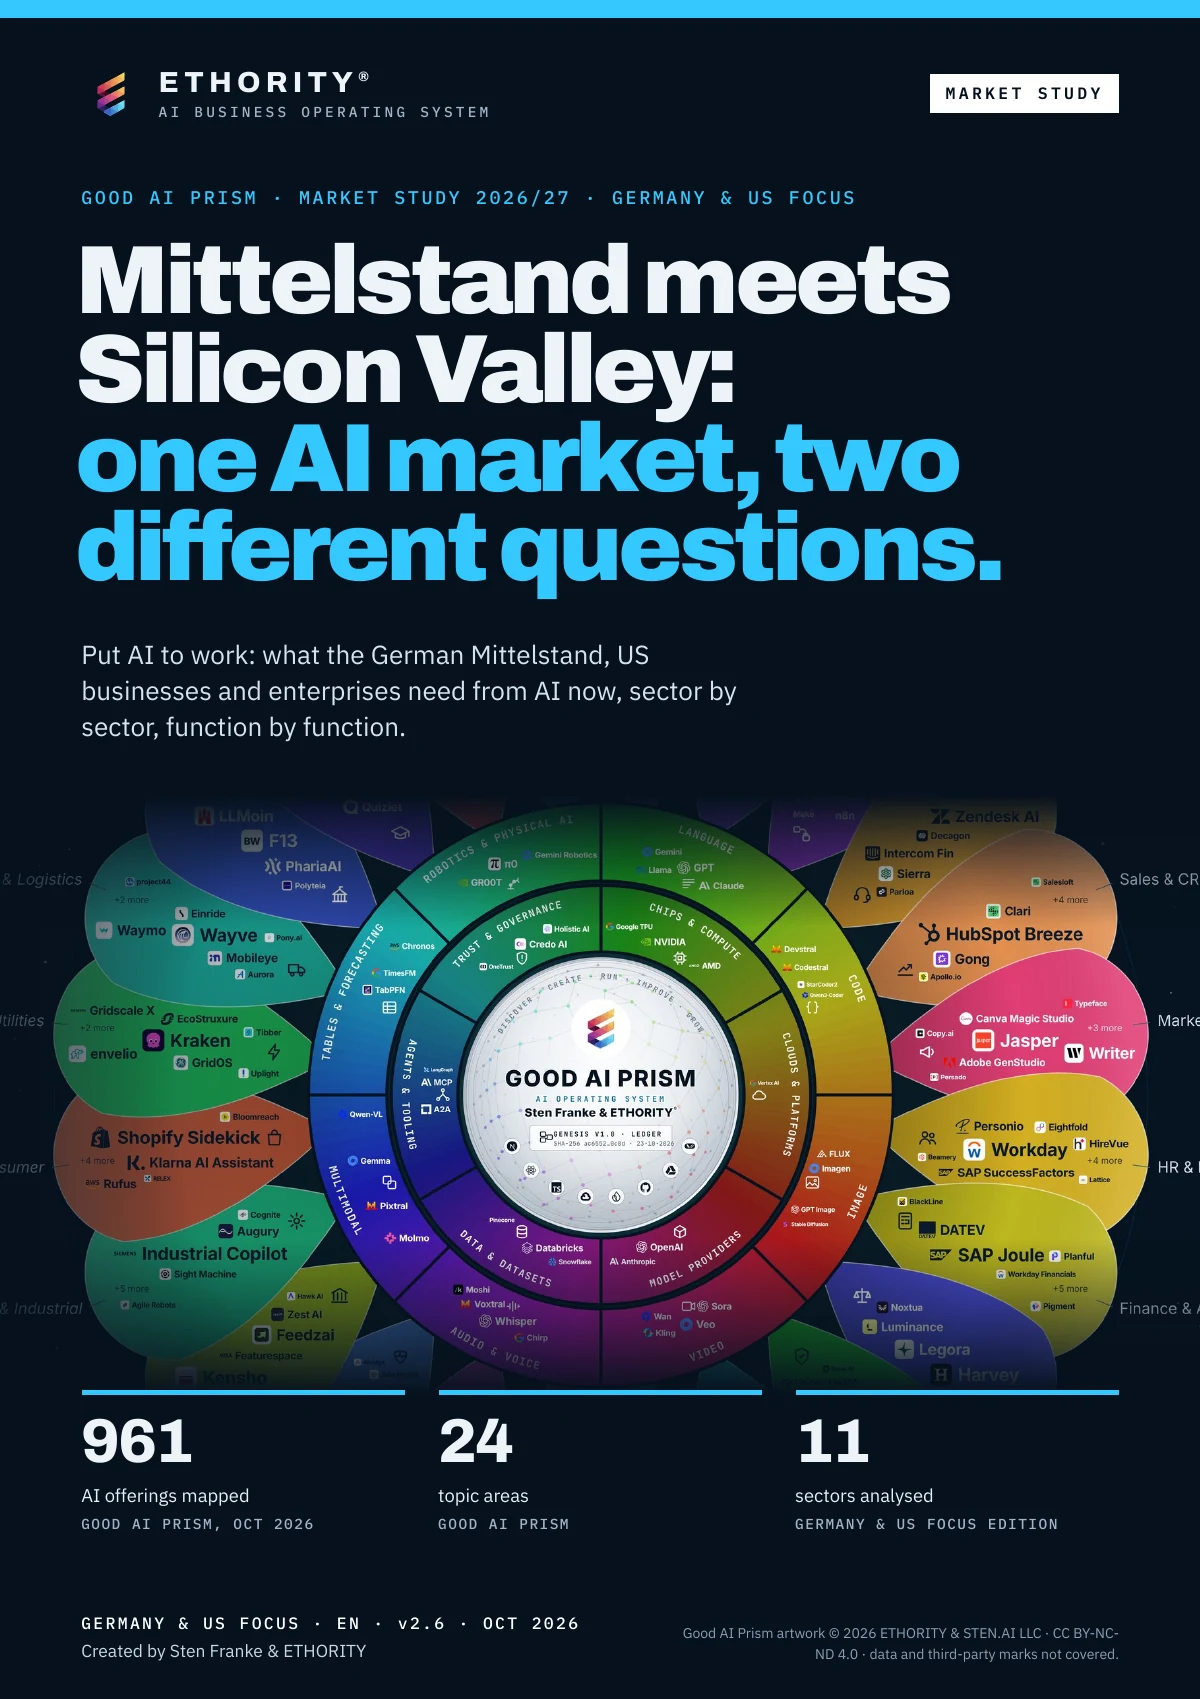
Spending on AI grows by half in 2026, use is broad and measured returns are thinner; these are the sourced figures that matter for planning 2027.
A new rule for this edition
The 2024 version of this article collected market-size projections from secondary aggregators: trillions added to GDP by 2030, millions of new jobs, market sizes per industry. Many of those figures could not be traced to a primary study, and several described years that have now passed. This edition uses only figures with a named publisher, a date and, where relevant, a sample. Survey results are shown separately; they are not stages of one funnel.
Spending: up by half, mostly into infrastructure
- Worldwide AI spending is forecast at US$2.67 trillion in 2026, up 49.5% from US$1.79 trillion in 2025, and US$3.64 trillion in 2027. AI infrastructure accounts for US$1.48 trillion of the 2026 total (Gartner, September 2026).
- Within that total, spending on AI agents and assistants grows from US$29.2 billion in 2026 to US$65.5 billion in 2027 (Gartner).
- Enterprise generative AI spending reached US$37 billion in 2025, 3.2 times the 2024 level (Menlo Ventures, December 2025).
- European AI spending is forecast to reach US$290 billion by 2029, growing 33.7% a year (IDC, April 2026).
- Germany's AI market is forecast at €28.7 billion in 2026 (+48%) (Bitkom/IDC).
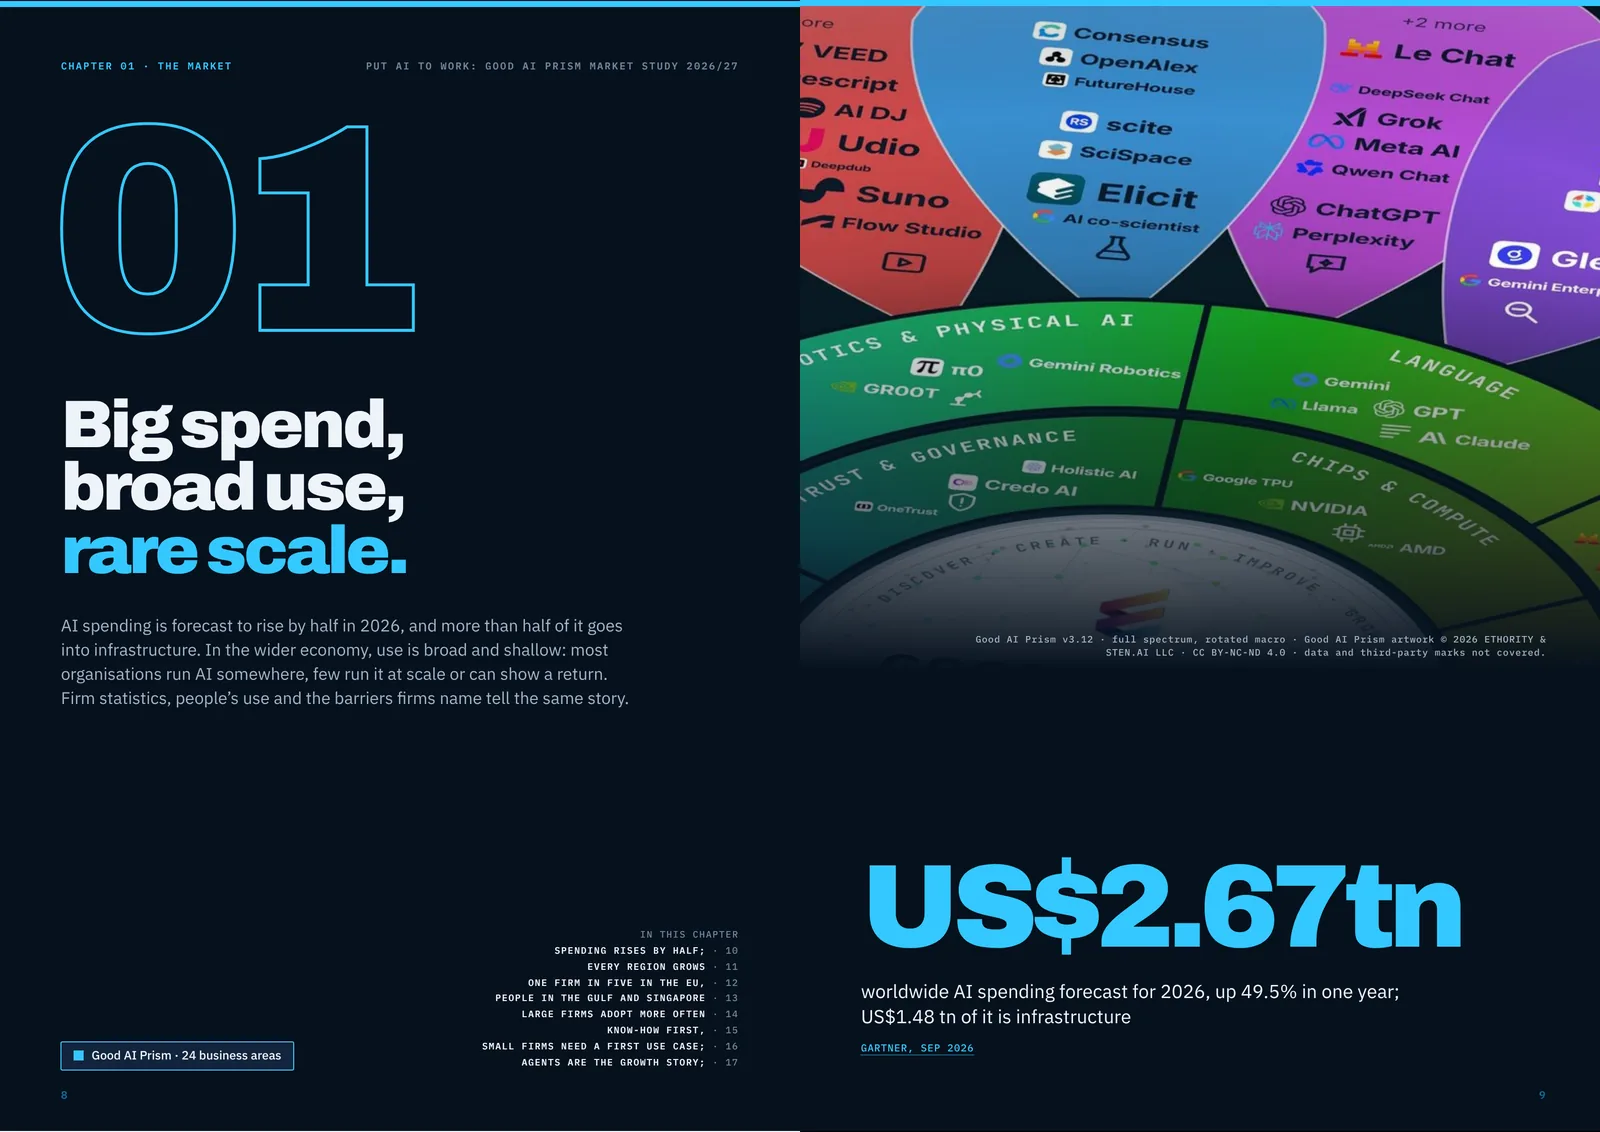
US$2.67tn — worldwide AI spending forecast for 2026, up 49.5% in one year; US$1.48 tn of it is infrastructure
GARTNER, SEP 2026
Source study · v2.1 · page 8-9 · Figure published: 25 Oct 2026
Read figure text, sources and rights
CHAPTER 01 · THE MARKET PUT AI TO WORK: GOOD AI PRISM MARKET STUDY 2026/27 01 Big spend, broad use, rare scale. AI spending is forecast to rise by half in 2026, and more than half of it goes into infrastructure. In the wider economy, use is broad and shallow: most organisations run AI somewhere, few run it at scale or can show a return. Firm statistics, people’s use and the barriers firms name tell the same story. Good AI Prism · 24 business areas IN THIS CHAPTER SPENDING RISES BY HALF; · 10 EVERY REGION GROWS · 11 ONE FIRM IN FIVE IN THE EU, · 12 PEOPLE IN THE GULF AND SINGAPORE · 13 LARGE FIRMS ADOPT MORE OFTEN · 14 KNOW-HOW FIRST, · 15 SMALL FIRMS NEED A FIRST USE CASE; · 16 AGENTS ARE THE GROWTH STORY; · 17 8 Good AI Prism v3.12 · full spectrum, rotated macro · Good AI Prism artwork © 2026 ETHORITY & STEN.AI LLC · CC BY-NC-ND 4.0 · data and third-party marks not covered. US$2.67tn worldwide AI spending forecast for 2026, up 49.5% in one year; US$1.48 tn of it is infrastructure GARTNER, SEP 2026 9
Source links on the cited study page
ETHORITY figure. Rights in cited data and third-party marks remain with their owners. The Prism artwork licence applies where stated on the figure.
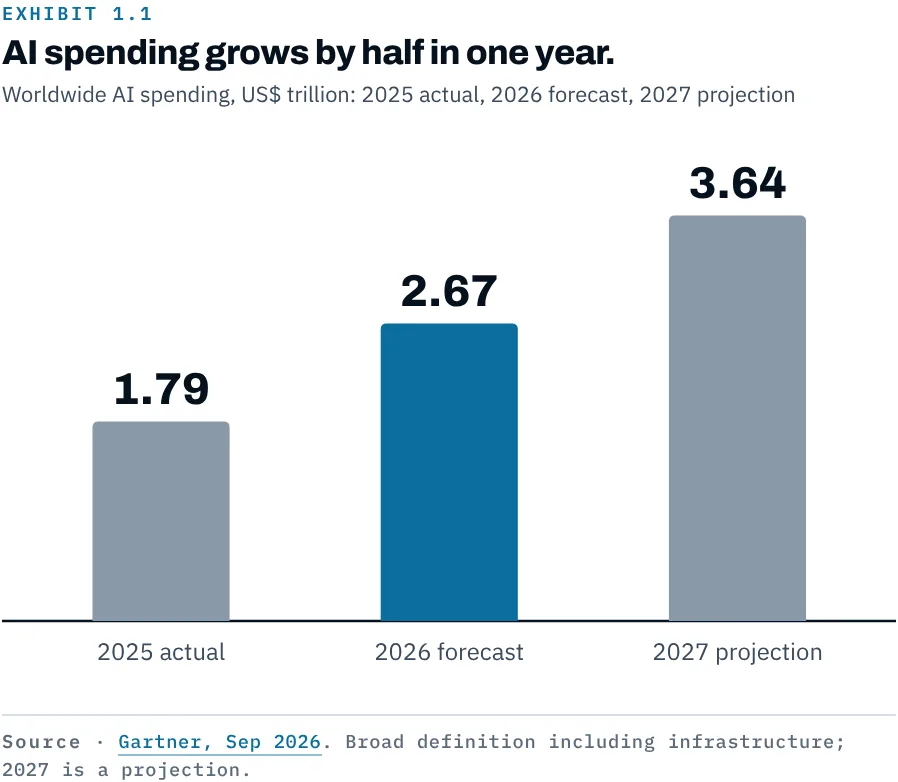
AI spending grows by half in one year.
Gartner, Sep 2026. Broad definition including infrastructure; 2027 is a projection.
Source study · v2.1 · page 10 · Figure published: 25 Oct 2026
Read figure text, sources and rights
EXHIBIT 1.1 AI spending grows by half in one year. Worldwide AI spending, US$ trillion: 2025 actual, 2026 forecast, 2027 projection 1.79 2025 actual 2.67 2026 forecast 3.64 2027 projection Source · Gartner, Sep 2026. Broad definition including infrastructure; 2027 is a projection. 1.79 2025 actual 2.67 2026 forecast 3.64 2027 projection
Source links on the cited study page
ETHORITY figure. Rights in cited data and third-party marks remain with their owners. The Prism artwork licence applies where stated on the figure.
Investment and capacity
- US private AI investment reached US$285.9 billion in 2025, against US$20.9 billion for Europe and US$12.4 billion for China (Stanford AI Index 2026). HAI notes that state-backed Chinese funds are not captured.
- Global AI compute capacity reached about 17 million H100-equivalents in Q4 2025 (Stanford AI Index 2026).
- NVIDIA reported US$89.0 billion in data-centre revenue for Q2 of fiscal 2027, up 117% (August 2026).
- Big-tech capital spending exceeded US$400 billion in 2025 and is set to rise a further 75% in 2026 (IEA, April 2026).
Adoption: broad, but measured differently
- In a global survey, nearly nine in ten organisations report regular AI use in at least one function; 44% report scaling it and 37% attribute some EBIT effect to AI (McKinsey, August 2026; n=1,719, 97 countries).
- Official statistics give a soberer picture: 20% of EU enterprises with ten or more staff used AI in 2025, up from 13.5% (Eurostat). Denmark leads at 42%.
- In Germany, 57% of companies with 20 or more employees use AI in 2026, up from 36% in 2025 and 20% in 2024 (Bitkom, n=603).
- In the US, 19.8% of businesses used AI to produce goods or services in May 2026 (Census Bureau).
- Among people, 18.8% of the working-age population worldwide used generative AI in Q2 2026 (Microsoft, telemetry).
- In every national study we compared, large firms use AI more often than small ones, by 1.6 to 4.3 times (EU: 55% vs 17%).
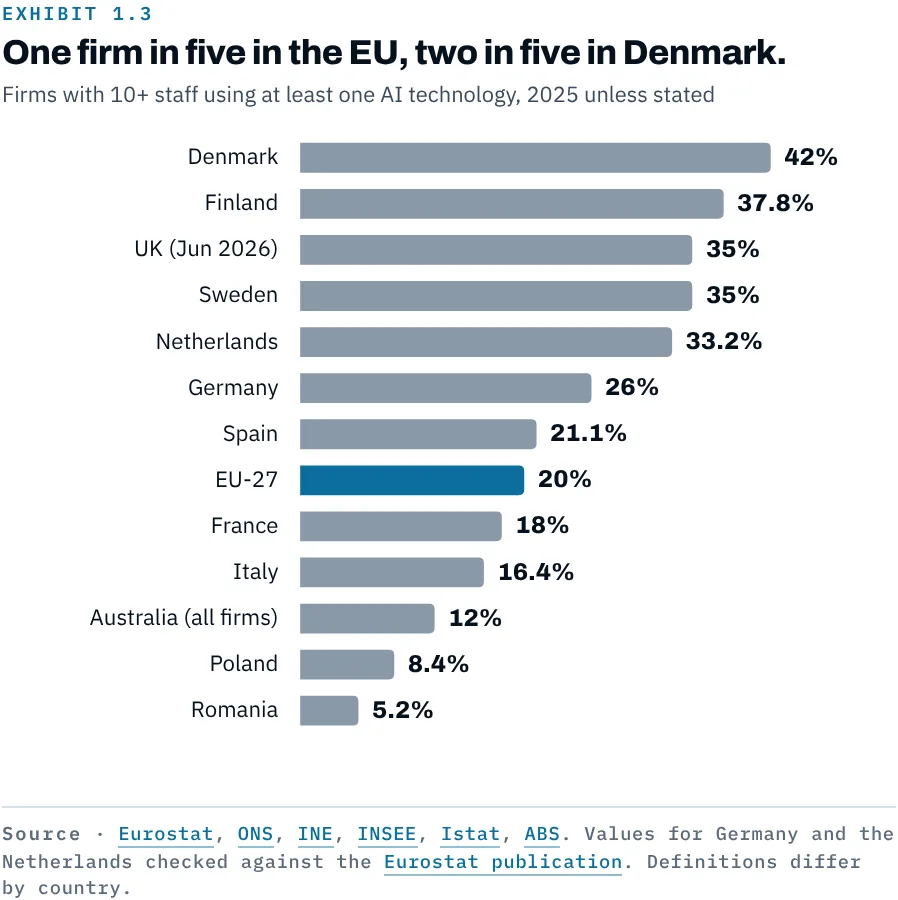
One firm in five in the EU, two in five in Denmark.
Eurostat, ONS, INE, INSEE, Istat, ABS. Values for Germany and the Netherlands checked against the Eurostat publication. Definitions differ by country.
Source study · v2.1 · page 12 · Figure published: 25 Oct 2026
Read figure text, sources and rights
EXHIBIT 1.3 One firm in five in the EU, two in five in Denmark. Firms with 10+ staff using at least one AI technology, 2025 unless stated Denmark 42% Finland 37.8% UK (Jun 2026) 35% Sweden 35% Netherlands 33.2% Germany 26% Spain 21.1% EU-27 20% France 18% Italy 16.4% Australia (all firms) 12% Poland 8.4% Romania 5.2% Source · Eurostat, ONS, INE, INSEE, Istat, ABS. Values for Germany and the Netherlands checked against the Eurostat publication. Definitions differ by country. Denmark 42% Finland 37.8% UK (Jun 2026) 35% Sweden 35% Netherlands 33.2% Germany 26% Spain 21.1% EU-27 20% France 18% Italy 16.4% Australia (all firms) 12% Poland 8.4% Romania 5.2%
Source links on the cited study page
- ec.europa.eu ↗
- www.ons.gov.uk ↗
- www.ine.es ↗
- www.insee.fr ↗
- www.istat.it ↗
- www.abs.gov.au ↗
- ec.europa.eu ↗
ETHORITY figure. Rights in cited data and third-party marks remain with their owners. The Prism artwork licence applies where stated on the figure.
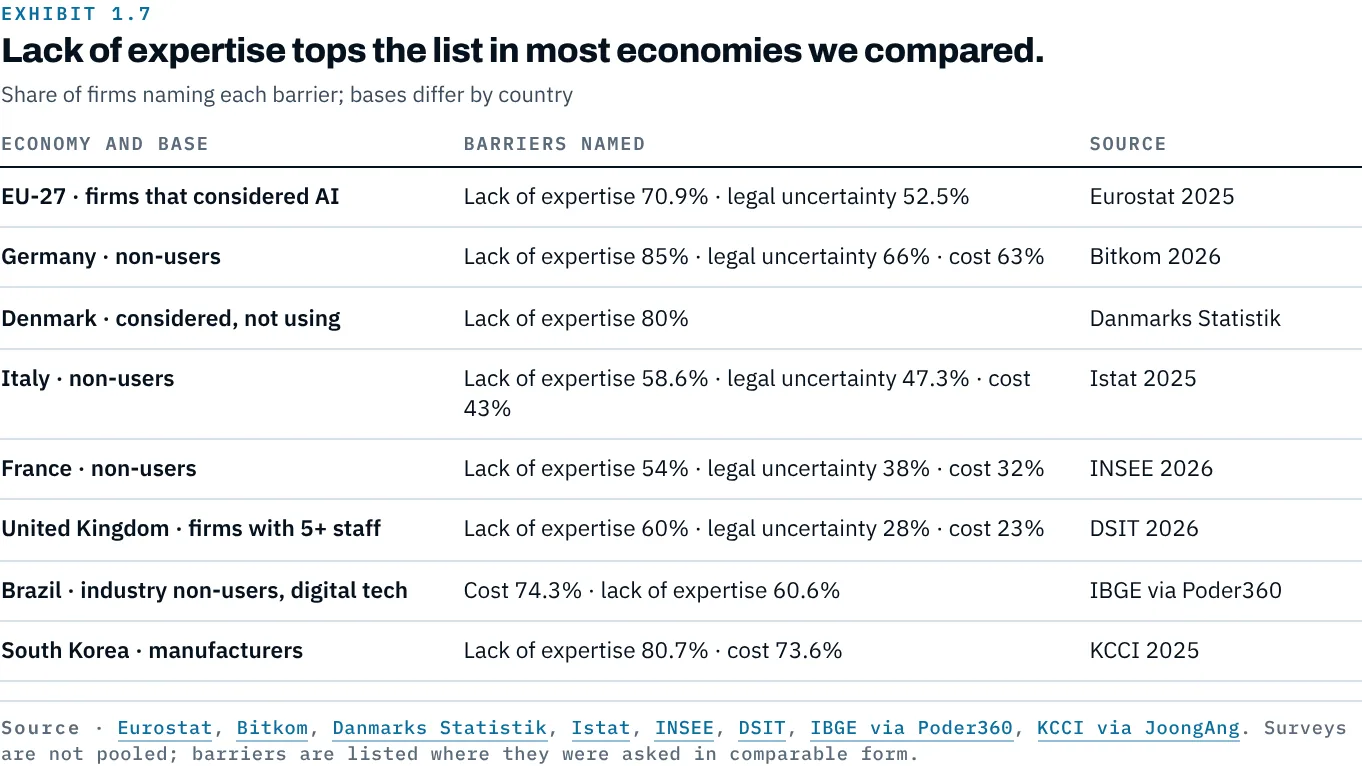
Lack of expertise tops the list in most economies we compared.
Eurostat, Bitkom, Danmarks Statistik, Istat, INSEE, DSIT, IBGE via Poder360, KCCI via JoongAng. Surveys are not pooled; barriers are listed where they were asked in comparable form.
Source study · v2.1 · page 15 · Figure published: 25 Oct 2026
Read figure text, sources and rights
EXHIBIT 1.7 Lack of expertise tops the list in most economies we compared. Share of firms naming each barrier; bases differ by country ECONOMY AND BASE BARRIERS NAMED SOURCE EU-27 · firms that considered AI Lack of expertise 70.9% · legal uncertainty 52.5% Eurostat 2025 Germany · non-users Lack of expertise 85% · legal uncertainty 66% · cost 63% Bitkom 2026 Denmark · considered, not using Lack of expertise 80% Danmarks Statistik Italy · non-users Lack of expertise 58.6% · legal uncertainty 47.3% · cost 43% Istat 2025 France · non-users Lack of expertise 54% · legal uncertainty 38% · cost 32% INSEE 2026 United Kingdom · firms with 5+ staff Lack of expertise 60% · legal uncertainty 28% · cost 23% DSIT 2026 Brazil · industry non-users, digital tech Cost 74.3% · lack of expertise 60.6% IBGE via Poder360 South Korea · manufacturers Lack of expertise 80.7% · cost 73.6% KCCI 2025 Source · Eurostat, Bitkom, Danmarks Statistik, Istat, INSEE, DSIT, IBGE via Poder360, KCCI via JoongAng. Surveys are not pooled; barriers are listed where they were asked in comparable form.
Source links on the cited study page
- ec.europa.eu ↗
- bitkom-research.de ↗
- www.dst.dk ↗
- www.istat.it ↗
- www.insee.fr ↗
- gov.uk ↗
- www.poder360.com.br ↗
- www.koreajoongangdaily.com ↗
ETHORITY figure. Rights in cited data and third-party marks remain with their owners. The Prism artwork licence applies where stated on the figure.
Sectors: where it stands
| Sector | Latest figure | Source |
|---|---|---|
| Health | 81% of US physicians use AI, mostly for documentation | AMA, Mar 2026 |
| Banking | 92% of EU banks deploy AI | EBA |
| Manufacturing | 88% of US mid-market manufacturers have integrated AI | RSM, 2026 |
| Retail | About 14% of US retail firms use AI | US Census, May 2026 |
| Utilities | 81% of North American utilities use AI | Itron |
| Logistics | Active AI use rose from 16% to 43% in a year | Logistics Management, Sep 2026 |
| Research | 84% of researchers use AI, up from 57% | Wiley |
| Education | 60% of US teachers used AI; weekly users save 5.9 hours a week | Gallup-Walton |
Models and prices
The model layer has moved fast. At the top of the leaderboard, the best US and Chinese models are 2.7% apart, and the best closed model leads the best open-weight model by 3.3% (Stanford AI Index 2026). Flagship API prices now span about 100 times, from USD 0.10 to USD 10 per million input tokens (OpenAI, Anthropic, Google list prices, October 2026). Per-unit inference prices have fallen by 9 to 900 times a year depending on the capability threshold (Epoch AI). Cheaper units do not mean smaller bills: volume grows faster.
Energy and physical AI
- Data centres used about 485 TWh in 2025, projected to reach about 950 TWh by 2030, around 3% of global electricity demand; use by AI-focused data centres rose 50% in 2025 (IEA, 2026).
- In Ireland, data centres used 22% of metered electricity in 2024 (CSO).
- More than 600,000 industrial robots were installed worldwide in 2025 (+11%), and the operational stock reached a record 5 million (IFR, September 2026).
- Almost 250,000 professional service robots were sold in 2025 (+24%); transport and logistics accounted for 47% (IFR).
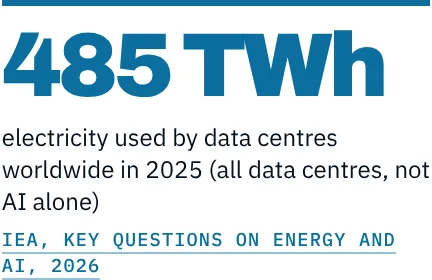
485 TWh — electricity used by data centres worldwide in 2025 (all data centres, not AI alone)
IEA, KEY QUESTIONS ON ENERGY AND AI, 2026
Source study · v2.1 · page 58 · Figure published: 25 Oct 2026
Read figure text, sources and rights
485 TWh electricity used by data centres worldwide in 2025 (all data centres, not AI alone) IEA, KEY QUESTIONS ON ENERGY AND AI, 2026
Source links on the cited study page
ETHORITY figure. Rights in cited data and third-party marks remain with their owners. The Prism artwork licence applies where stated on the figure.
Value: real, specific and still rare
- 37% of organisations attribute some EBIT effect to AI (McKinsey, August 2026); 56% of CEOs report no significant financial benefit so far (PwC, January 2026).
- Where measured, gains are task-specific: +14% issues resolved per hour in customer support, +34% for less experienced agents (NBER).
- In finance, 59% of finance functions use AI, flat year on year, and 91% report low or moderate impact (Gartner).
- Know-how is the barrier named most often: 71% of EU firms that considered AI and 85% of German non-users (Eurostat; Bitkom).

Spending rises by half; an EBIT effect stays rare.
MCKINSEY, AUG 2026 · MCKINSEY, AUG 2026 · MCKINSEY, AUG 2026 · MICROSOFT, SEP 2026
Source study · v2.1 · page 10 · Figure published: 25 Oct 2026
Read figure text, sources and rights
~90% of organisations in a global survey report regular AI use in at least one function MCKINSEY, AUG 2026 44% report scaling it across the enterprise MCKINSEY, AUG 2026 37% attribute some EBIT effect to AI MCKINSEY, AUG 2026 18.8% of working-age people worldwide use generative AI MICROSOFT, SEP 2026
Source links on the cited study page
ETHORITY figure. Rights in cited data and third-party marks remain with their owners. The Prism artwork licence applies where stated on the figure.
What the figures mean
Spending and use are rising fast; proven value lags behind. The distance between trying AI and running it in a core process is where value is won. For most organisations, the useful question for 2027 is not whether to use AI but which process to change first, how to measure it and who owns the result. The Good AI Prism study turns these figures into a buyer worksheet and a pilot charter for exactly that step.
Read every percentage with its denominator
An adoption figure is incomplete without knowing who was asked and what counted as use. A survey of large enterprises, a representative business survey and a poll of individual workers describe different populations. A company testing one assistant is not necessarily operating AI across its processes. A planned investment is not expenditure already made. Keep those distinctions when using a chart in an executive discussion.
Write a short source note for the figures that affect your decision: population, geography, fieldwork period, definition and whether the result is observed or forecast. Where the original source supplies uncertainty or a methodological change, retain it. Do not present differences between incompatible surveys as a precise ranking of countries or industries. They may show different measurement choices as well as different behaviour.
The US Census Bureau's May 2026 business article is useful because it identifies its survey and the differences by firm size and sector. Its estimates should remain attached to that setting. They do not measure your organisation's readiness or the economic return from a proposed deployment.
Separate market growth from a business case
Higher spending can reflect infrastructure investment, higher prices, wider use or a different mix of services. It does not automatically mean that each buyer receives more value. Similarly, lower token prices do not establish a lower cost for an accepted business result. The workload may grow, the model may generate more output or human review may remain the dominant expense.
Consider a hypothetical process with a low direct model bill and substantial checking effort. Cutting the model price in half may have little effect on total cost. Improving source quality or narrowing the task may matter more. Another process with very large usage and little review may be highly sensitive to model pricing. The same market trend supports different decisions in different workflows.
Use growth evidence to ask which dependency deserves attention. Infrastructure demand may matter to capacity planning; a model retirement matters to regression testing; a change in billing matters to unit economics. None creates a requirement to buy more AI. A market fact becomes useful when it changes a specific assumption in a business decision.
Interpret sector examples at the right level
A physician reporting AI use may mean documentation assistance rather than autonomous clinical decision-making. A manufacturer reporting a pilot may not have changed production. A retailer using generated marketing text is different from one allowing an agent to alter prices. Aggregate adoption can be informative without settling what technology is actually authorised to do.
This is particularly important when a statistic is used to create urgency. “Others are using AI” is not a sufficient reason to grant access to sensitive information or automate a consequential action. It can justify investigating a relevant opportunity. The next step should still identify the task, the affected people, the baseline and the evidence required.
Keep professional and legal boundaries in the interpretation. A research result in medicine does not establish the suitability of a tool for clinical use. A finance adoption survey does not establish compliant credit decisions. Those uses require application-specific evidence and accountable specialist review. A broad market report should help locate the question, not answer it beyond its scope.
Turn a forecast into a scenario you can test
Forecasts describe a possible future under a method and assumptions. Preserve their forecast status even after the publication year changes. An anticipated market size is not a measured result. If a forecast matters to your plan, explain the mechanism: expected supplier availability, capacity requirements, price exposure or demand for a service.
Build at least an ordinary and a constrained scenario. What happens if usage grows more slowly, review remains expensive or an integration takes longer? What happens if the chosen model is withdrawn? The purpose is to identify a robust next step, not produce a precise financial story from uncertain market totals.
For your own project, record volume, acceptance, review time and total cost. Use the economics tools to inspect the result and its sensitivity. Potential released capacity remains different from realised financial value. A scenario can guide a pilot; the pilot must supply the observations needed to revise it.
Use sources to improve the decision after purchase
Market intelligence is useful beyond the initial shortlist. Keep the material dependencies from the decision: model family, deployment route, contract and integration. A relevant source change can then be routed to the person who owns the affected assumption. Without that connection, a stream of industry news becomes an additional reading burden rather than operating intelligence.
Do not turn every announcement into an immediate migration. A benchmark improvement may not matter to the task, while a modest contractual change may be decisive. Compare the current workflow with the proposed alternative using the same acceptance rules and costs. Preserve a reasoned decision to stay with an existing configuration when that is the better supported choice.
A five-minute check before reusing a market chart
Find the original source rather than another presentation quoting it. Identify the measured population, the fieldwork period and the definition of AI use. Check whether the headline describes current observation, an expectation or a spending forecast. Then ask whether the comparison in your chart uses the same definition on both sides.
Read the qualification that would most affect an executive decision. A figure limited to large firms should not be labelled as all businesses. A survey of self-reported benefits should not be relabelled as audited profit. A change in the question can interrupt a time series even if the chart looks continuous.
Finish by writing the decision the chart supports. It may justify investigating a particular workflow or asking a supplier about capacity. If the only conclusion is that AI is important, the chart is orientation rather than a business case. Keep that role explicit. Good market intelligence helps people ask better questions without turning every growth statistic into a recommendation to purchase.
Move from a market fact to useful work
The Good AI Prism connects business areas with candidate products and documented relationships. Profiles and Compare keep material conditions close to the offering. The study overview provides the selected edition's scope and sources. Neither is a universal recommendation for your organisation.
A focused supplier question may suit an AI Decision Brief. A business investment question may require a proposal-based Enterprise AI Opportunity Case. Bring the statistic you are relying on and the decision it is supposed to support. The useful output is not a larger collection of impressive numbers. It is a clearer understanding of what the evidence changes, what it leaves open and what to test next.
What to decide now
- Name the one process where AI in production would matter most to your results, and its accountable owner.
- Measure that process today (volume, cost, quality, cycle time) so that any future gain is your own number, not a market average.
- Budget for the full cost: in Germany, firms name cloud and compute (51%), data preparation (50%) and integration (41%) as cost drivers ahead of licences (21%).
All figures, with sample sizes and definitions, are in the Good AI Prism Global Market Study 2026/27 at ethority.ai/ai-prism-study.
Sources
- Gartner, worldwide AI spending forecast (16 Sep 2026): https://gartner.com/en/newsroom/press-releases/2026-09-16-gartner-forecasts-worldwide-ai-spending-to-grow-49-point-5-percent-in-2026
- Menlo Ventures, State of Generative AI in the Enterprise (Dec 2025): https://menlovc.com/perspective/2025-the-state-of-generative-ai-in-the-enterprise/
- IDC, European AI spending to 2029 (Apr 2026): https://www.idc.com/resource-center/press-releases/european-ai-spending-to-reach-290-billion-by-2029-driven-by-banking-software-and-agentic-ai-adoption/
- Bitkom/IDC, German AI market: https://www.bitkom.org/index.php/Presse/Presseinformation/Deutscher-KI-Markt-waechst-um-48-Prozent
- Stanford HAI, AI Index Report 2026: https://hai.stanford.edu/ai-index/2026-ai-index-report
- Stanford HAI, AI Index 2026, technical performance: https://hai.stanford.edu/ai-index/2026-ai-index-report/technical-performance
- Stanford HAI, AI Index 2026, research and development: https://hai.stanford.edu/ai-index/2026-ai-index-report/research-and-development
- NVIDIA, Q2 FY2027 results: https://investor.nvidia.com/news/press-release-details/2026/NVIDIA-Announces-Financial-Results-for-Second-Quarter-Fiscal-2027/
- IEA, data-centre electricity 2025 (Apr 2026): https://www.iea.org/news/data-centre-electricity-use-surged-in-2025-even-with-tightening-bottlenecks-driving-a-scramble-for-solutions
- IEA, Key Questions on Energy and AI: https://www.iea.org/reports/key-questions-on-energy-and-ai/executive-summary
- McKinsey, The state of AI (Aug 2026): https://www.mckinsey.com/capabilities/quantumblack/our-insights/the-state-of-ai
- Eurostat, 20% of EU enterprises used AI in 2025: https://ec.europa.eu/eurostat/web/products-eurostat-news/w/ddn-20251211-2
- Bitkom, majority of companies use AI (Sep 2026): https://www.bitkom.org/Presse/Presseinformation/Erstmals-nutzt-die-Mehrheit-der-Unternehmen-KI
- US Census Bureau, AI use by businesses (May 2026): https://census.gov/library/stories/2026/05/ai-use-businesses.html
- Microsoft, The continued state of global AI diffusion in 2026: https://blogs.microsoft.com/on-the-issues/2026/09/21/the-continued-state-of-global-ai-diffusion-in-2026/
- AMA (Mar 2026): https://ama-assn.org/press-center/ama-press-releases/ama-ai-usage-among-doctors-doubles-confidence-technology-grows
- EBA, AI in EU banking: https://www.eba.europa.eu/sites/default/files/2025-09/146b3558-d026-47bf-a872-f05e93ed30d2/Rising%20application%20of%20AI%20in%20EU%20banking%20and%20payments%20sector.pdf
- RSM, manufacturers using AI 2026: https://rsmus.com/insights/industries/manufacturing/manufacturers-using-ai-2026.html
- Itron: https://investors.itron.com/node/25786
- Logistics Management (Sep 2026): https://www.supplychain247.com/article/logistics-ai-use-adoption-trust-study
- Wiley: https://newsroom.wiley.com/press-releases/press-release-details/2025/AI-Adoption-Jumps-to-84-Among-Researchers-as-Expectations-Undergo-Significant-Reality-Check/
- Gallup-Walton, teachers and AI: https://nextgeninsights.waltonfamilyfoundation.org/wp-content/uploads/2025/06/Teachers_AI_Report.pdf
- Epoch AI, inference price trends: https://epoch.ai/data-insights/ai-inference-price-trends
- Anthropic, models overview (prices): https://platform.claude.com/docs/en/about-claude/models/overview
- OpenAI, GPT-6.1 Sol and Luna pricing: https://openai.com/index/introducing-gpt-6-1-sol/
- CSO Ireland, data centres metered electricity 2024: https://www.cso.ie/en/releasesandpublications/ep/p-dcmec/datacentresmeteredelectricityconsumption2024/keyfindings
- IFR, five million robots (Sep 2026): https://ifr.org/ifr-press-releases/five-million-robots-now-operate-in-factories-globally
- IFR, World Robotics 2026 Service Robots (Sep 2026): https://kyodonewsprwire.jp/release/202610017079
- PwC, 29th Global CEO Survey (Jan 2026): https://www.pwc.com/gx/en/news-room/press-releases/2026/pwc-2026-global-ceo-survey.html
- NBER Working Paper 31161: https://www.nber.org/papers/w31161
- Gartner, finance AI adoption (Nov 2025): https://www.gartner.com/en/newsroom/press-releases/2025-11-18-gartner-survey-shows-finance-ai-adoption-remains-steady-in-2025
- ETHORITY, Good AI Prism Global Market Study 2026/27: https://ethority.ai/ai-prism-study
Updated edition of the article first published on ethority.net in 2024; the original remains archived.